Disability Statistics
Overview
The Yang-Tan Institute on Employment and Disability at Cornell's ILR School (YTI) provides critical disability statistics synthesized from the U.S. Census Bureau. Their website, however, was outdated—built over a decade ago, it lacked interactivity, accessibility, and an intuitive user experience.
As part of INFO 4310: Interactive Data Visualization, I worked with YTI to redesign the website, implement interactive data visualizations, and enhance accessibility. My role evolved from a student contributor to a full-time summer researcher and frontend engineer, and later as an external consultant until the site's relaunch in February 2025.
Duration
Jan 2024 - Feb 2025
My Role
- Fullstack Development (Laravel/PHP/JavaScript/D3.js)
- Visual Design
- UI/UX Design
team
- Camille Lee
- Corbin Stickley
- Natalia Jordan
my contributions
- Enhanced Navigation & User Experience – Streamlined navigation to make finding disability statistics and interpreting results more intuitive.
- Improved Data Interactivity & Accessibility – Developed highly interactive data visualizations with D3.js, and improved support for screen readers and keyboard navigation.
- Faster Loading Times – Optimized data queries and visualization rendering to reduced update time by 85%.
Understanding User Needs
The platform serves a diverse audience, requiring a balance between rich data insights for experts and intuitive design for non-technical users. We identified the following user profiles:
- Disability organizations & advocacy groups - Professionals in workforce development & disability rights.
- Researchers & academics – Analyzing employment trends and demographic data.
- Policymakers & legislators – Making data-driven decisions for legislation and funding.
- People with disabilities & their families – Accessing statistics for advocacy and education.
Improving Navigation & Information Flow
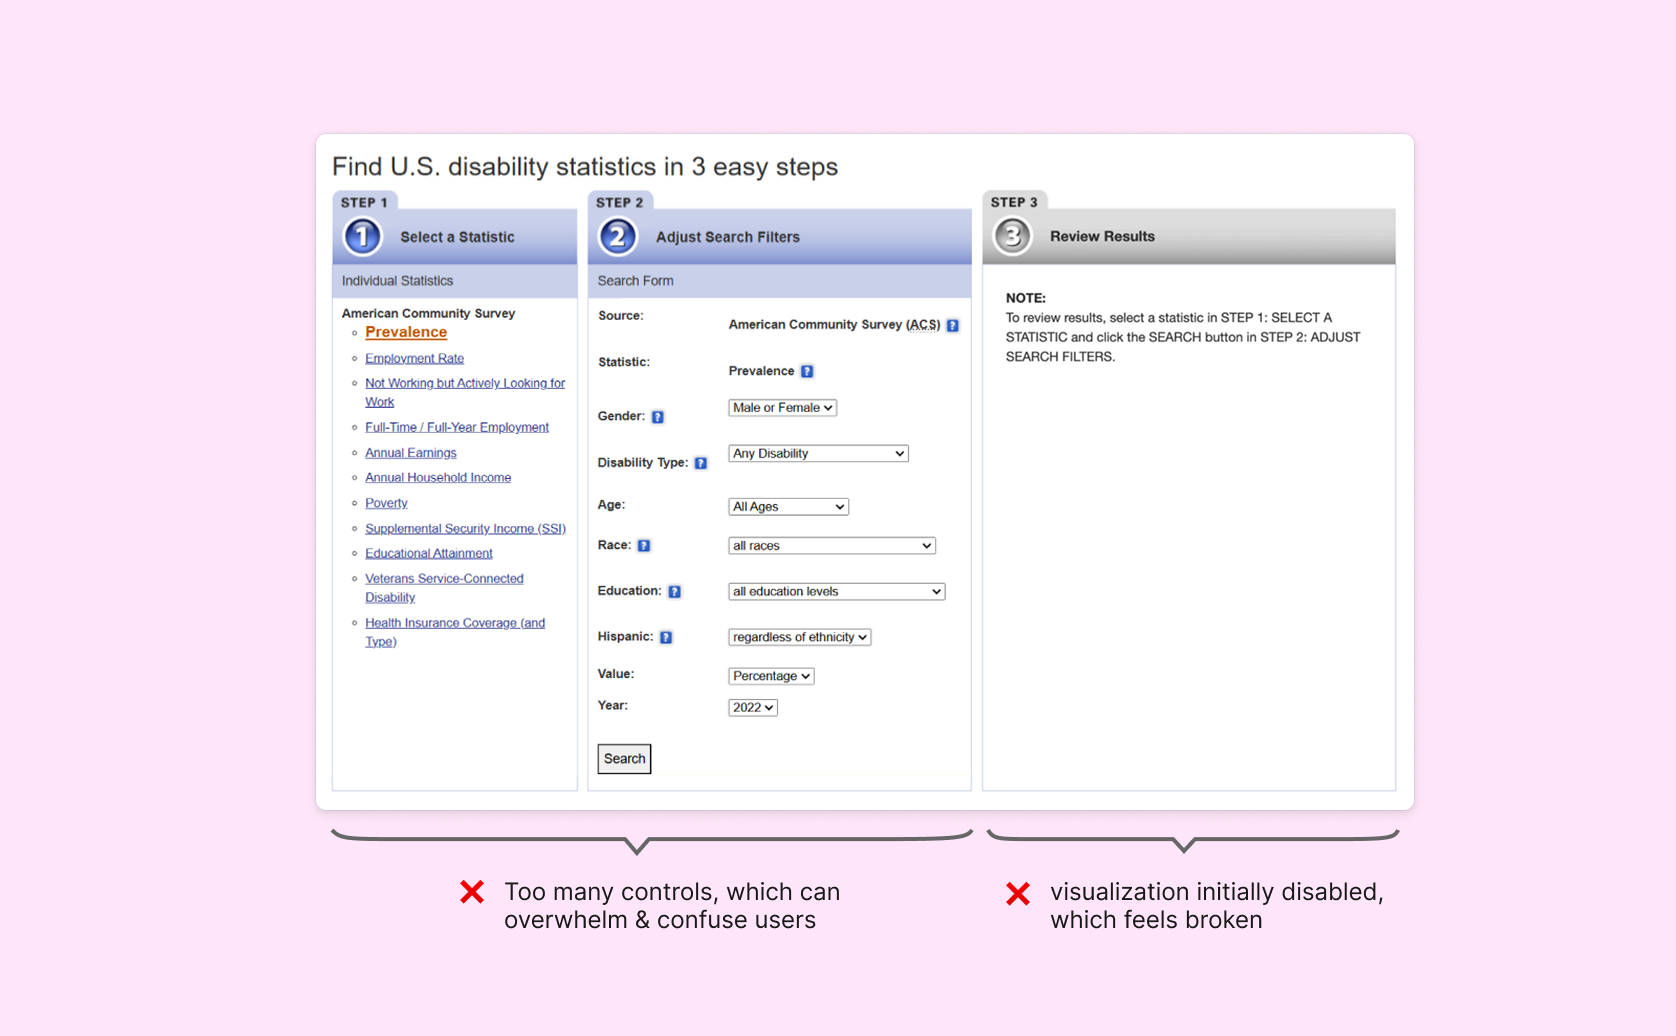
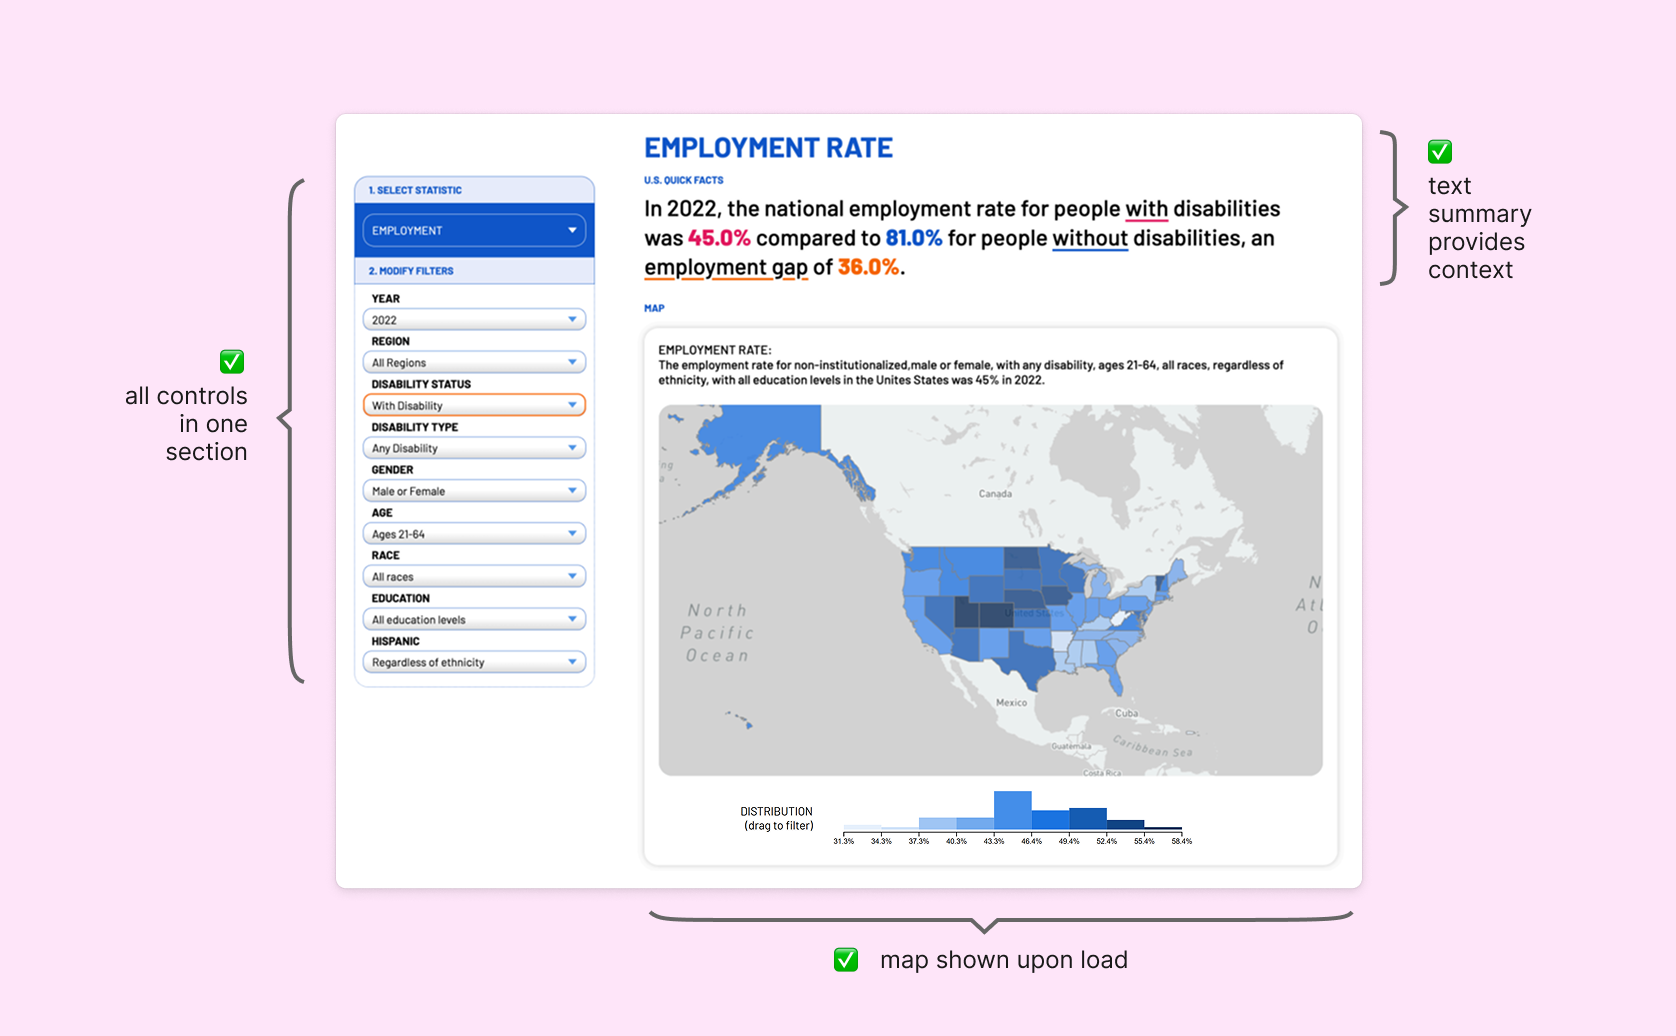
The original interface had three sections: select statistics, adjust filter, and view results. While this provided a clear sequence for navigation, the interface felt crowded and the data visualization section was pushed to the side. The visualization was also greyed out upon landing, and users often felt overwhelmed by the large amount of selection parameters and were unable to locate relevant statistics quickly.
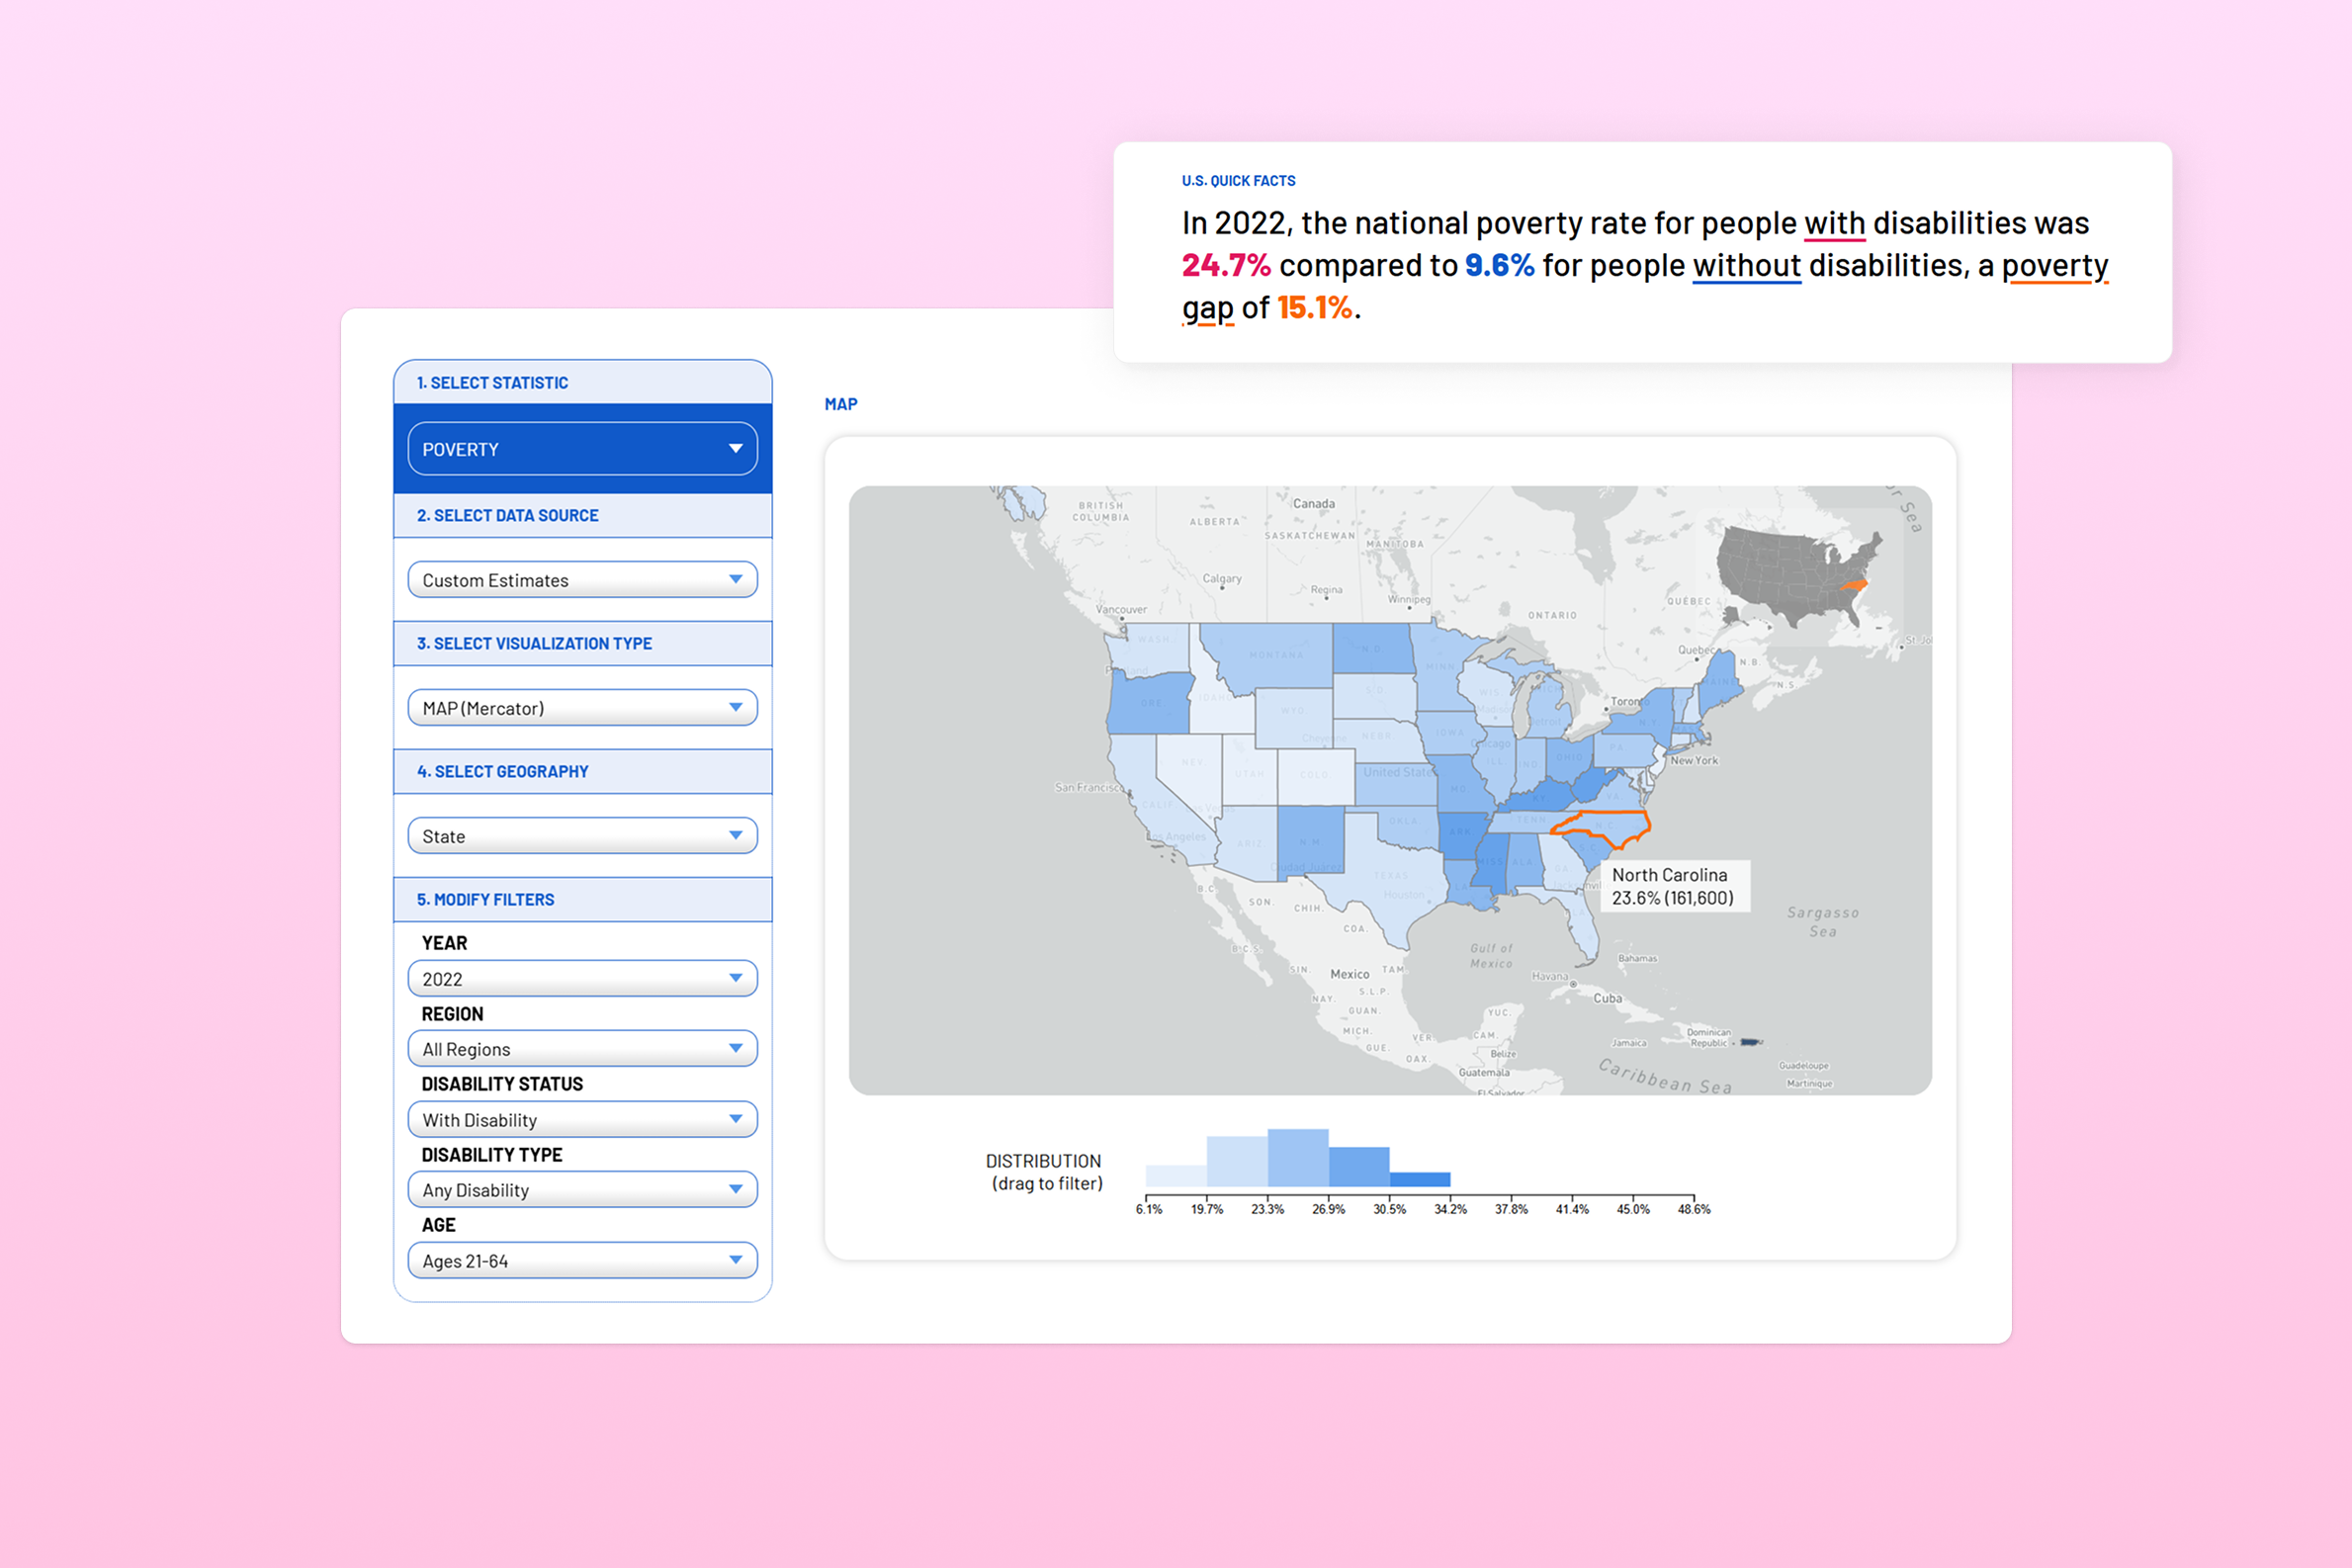
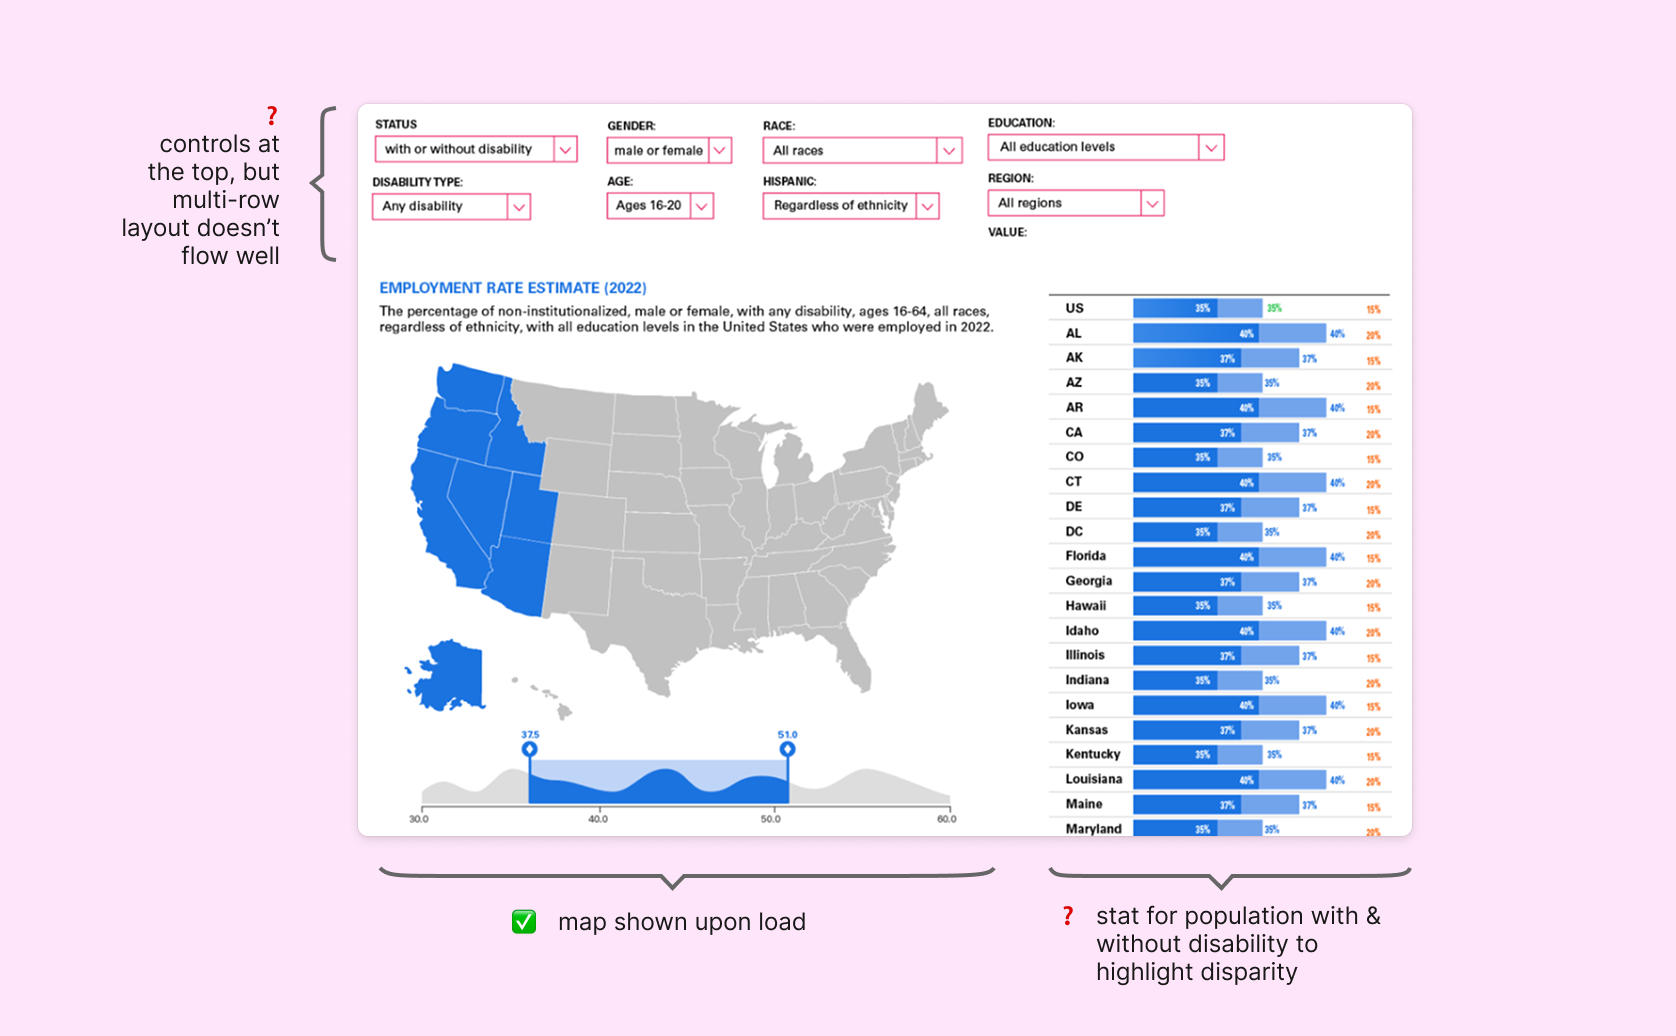
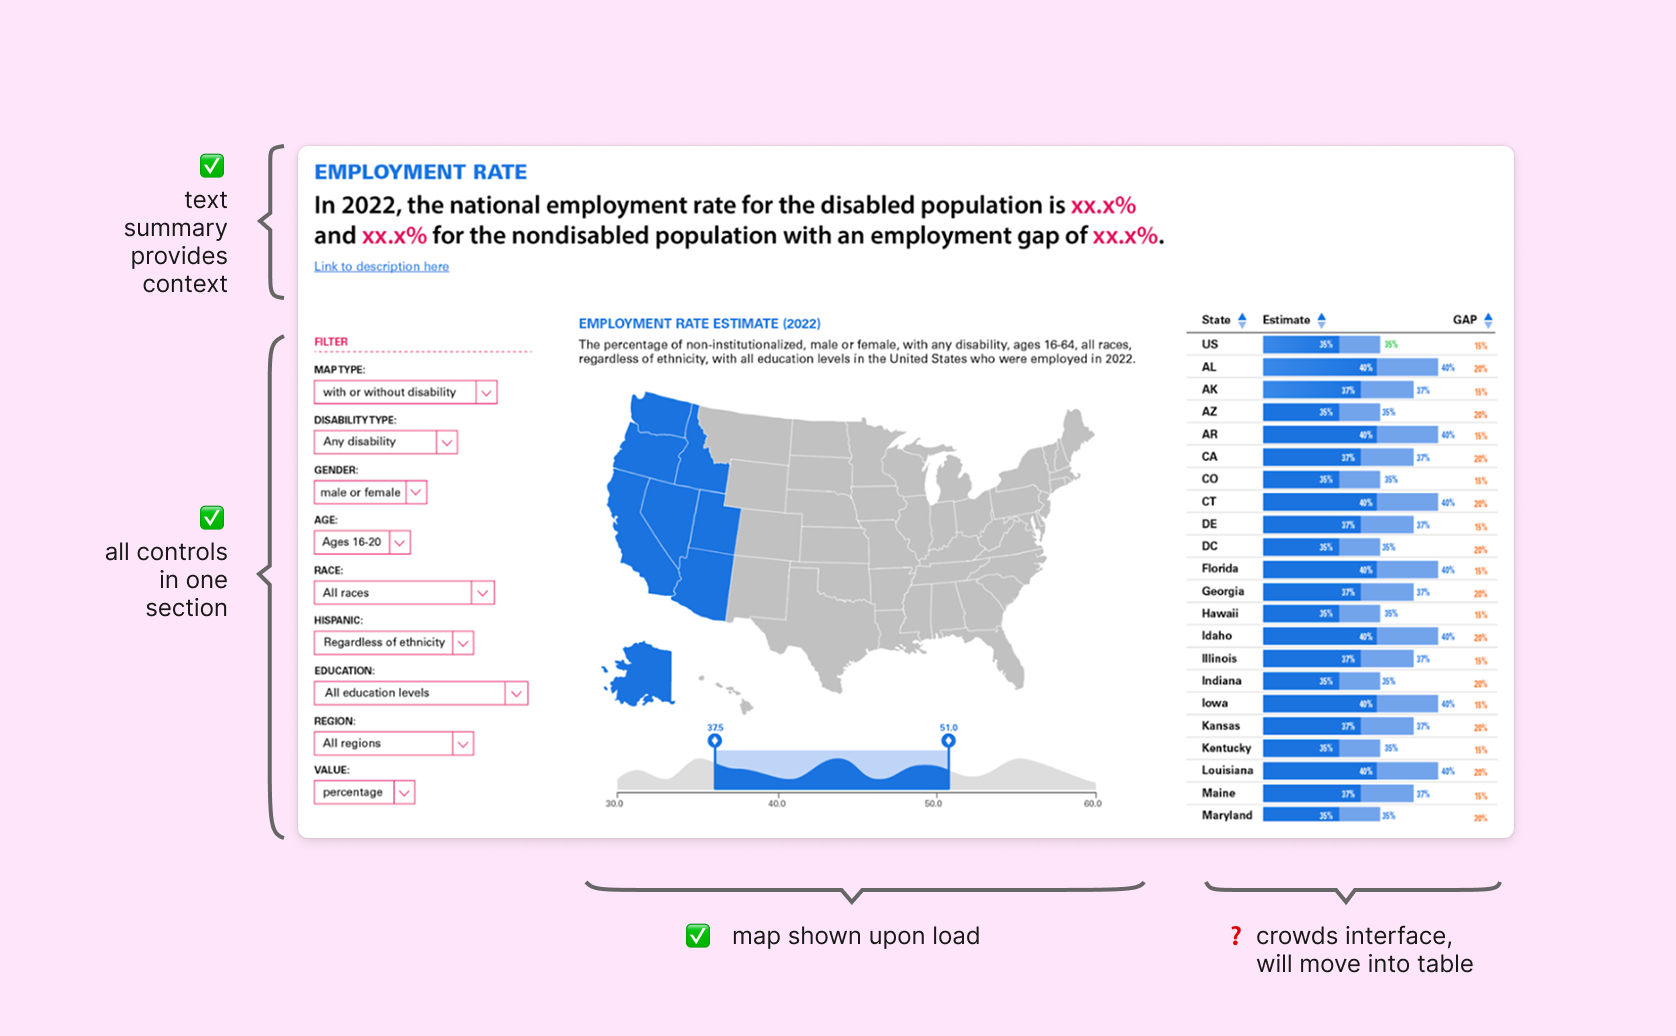
We redesigned the layout to condense set up and prioritize the visualization. Instead of starting with an empty page requiring user input, we wanted to display data immediately upon load, allowing users to interact with it as soon as they arrive. I also led the development of textual summary, which introduces the statistics before users dive into filters.
Enhancing Data Exploration with Interactive Maps & Filters
The previous site relied on Highcharts.js to render the map, but interactions such as zooming and panning were sluggish. Updates were triggered manually via a button, which caused the entire page to reload. To improve usability, I led the development of a highly interactive D3.js-based map that updates dynamically as users adjust filters. Additionally, I optimized the backend data-fetching API, reducing loading times by 85%. I also integrated a Mapbox base layer to provide greater contextual detail, supporting YTI's plans to introduce county- and congressional district-level data.
For improved navigation, I introduced a region-based filter (e.g., Northeast, Midwest) for quick regional analysis. I also added a legend in the top right to help users maintain orientation when zoomed in. Further, I implemented a histogram legend that doubles as a filter to help users refine data dynamically. The entire system is tightly linked—interactions with the map, histogram, and table update in sync.
YTI prioritized accessibility, so I implemented keyboard navigation for the map, allowing users to tab through states, zoom in and out, and pan using keyboard controls. This improvement ensured a more inclusive experience for all users.
More Insightful Tables
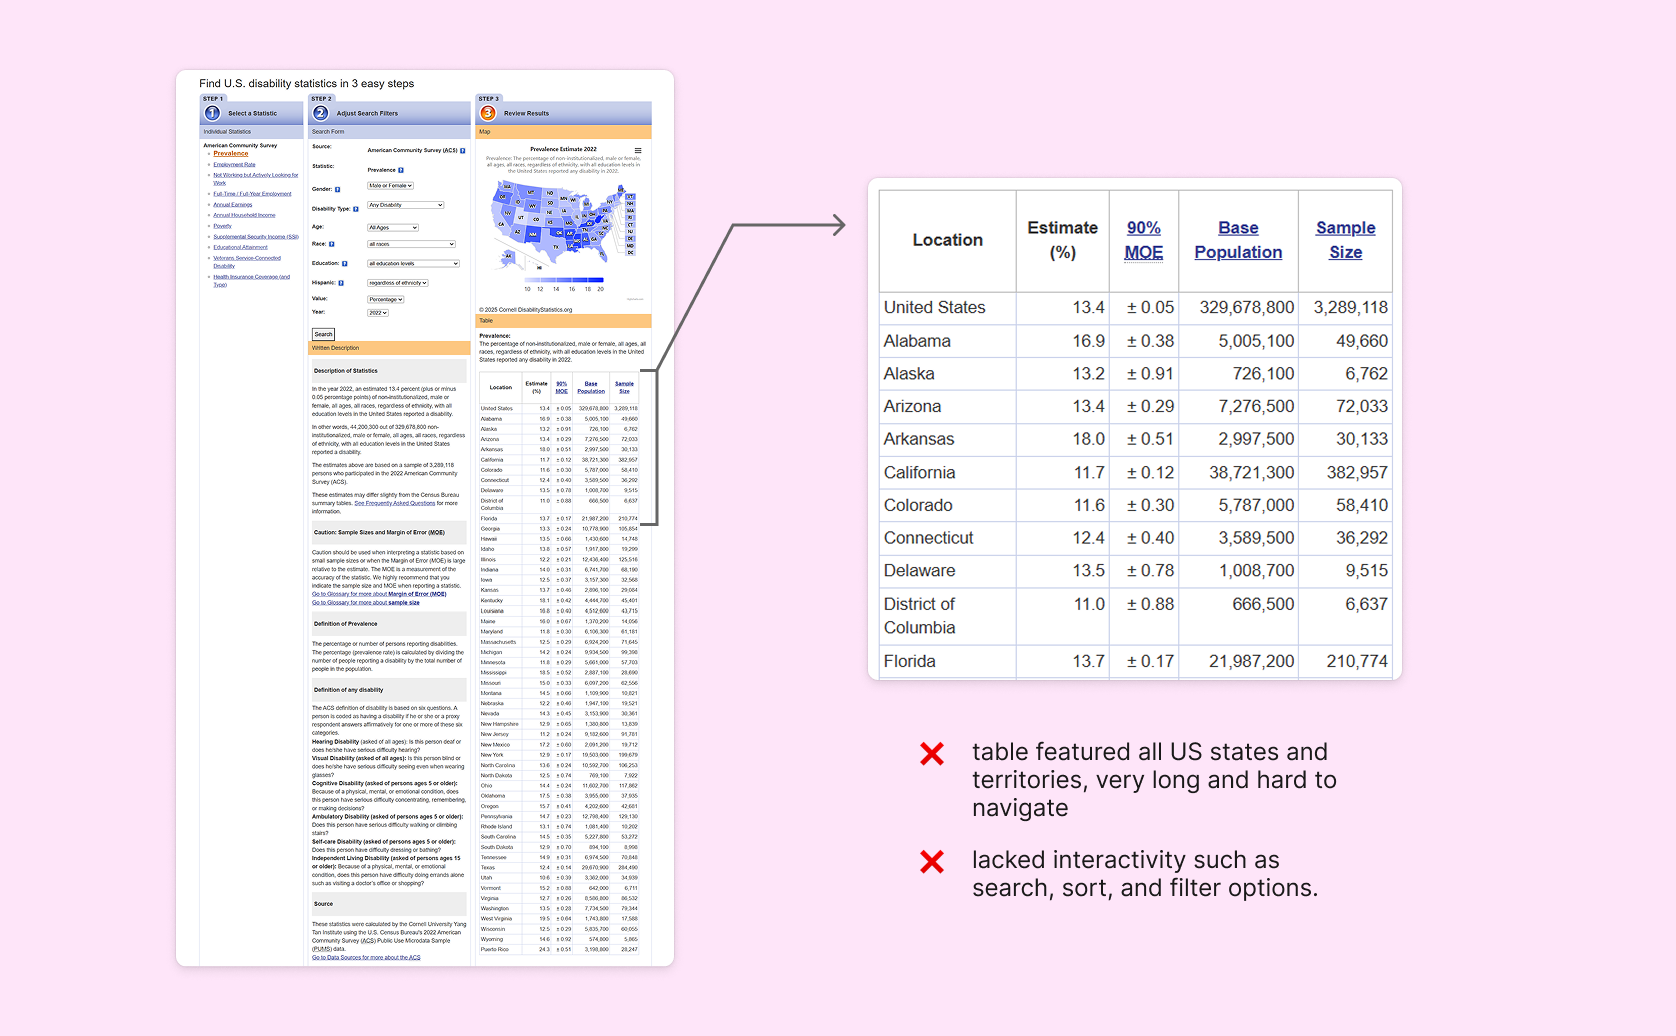
The previous table was difficult to navigate due to its length and the lack of search and filter functionality. It displayed data for all 50 states at once, making it overwhelming for users to find relevant insights. With the introduction of county- and congressional district-level data, it became clear that a more structured and interactive approach was needed.
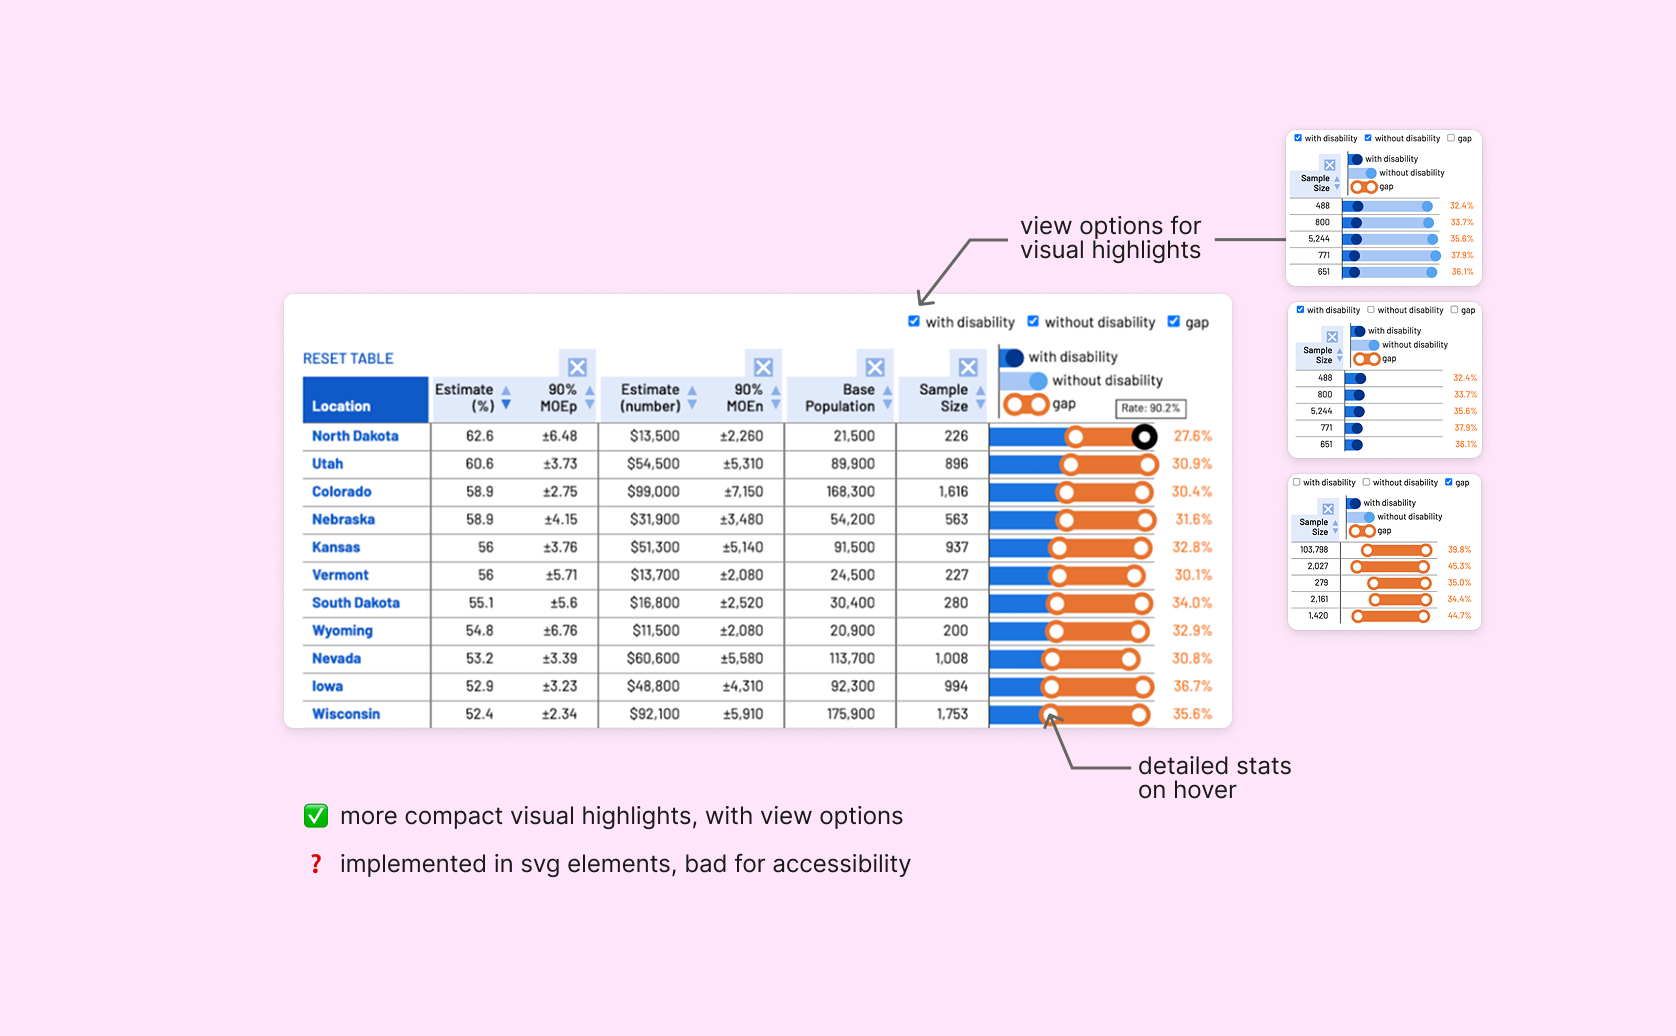
The first iterations aimed to provide a highly interactive experience, including toggleable columns and disparity visualizations with tooltips. However, it was built from SVG elements using D3.js and lacked screen reader compatibility, making it inaccessible to users with visual impairments.
To address this, I led the final design iteration of the table. It was created using semantic HTML and CSS to improve accessibility while also including some visual elements from before. The new table is fully responsive and supports search, sort, and filter functionality for easier data exploration. It is in sync with filters and the map, which allows users to better understand the data across different views.

Results & Learnings
- Design for clarity first – Users should never feel lost in the data.
- Interactivity should enhance, not overwhelm – Every interaction should be meaningful and accessible.
- Performance matters – Visualizations need to load and update quickly for great user experiences.
- Accessibility is non-negotiable – Inclusive design benefits all users.
The prototype I worked on was adopted in production and launched in February 2025 to positive feedback from policymakers & disability advocates. 50+ users signed up for further usability testing & feedback! You can check out the live site here.
This project reinforced my passion for bridging design & engineering to make complex datasets intuitive and actionable. Seeing the tool adopted for real-world policymaking has been incredibly rewarding, and I look forward to applying these learnings to future data-driven projects.