Rebar Analytics Platform
Overview
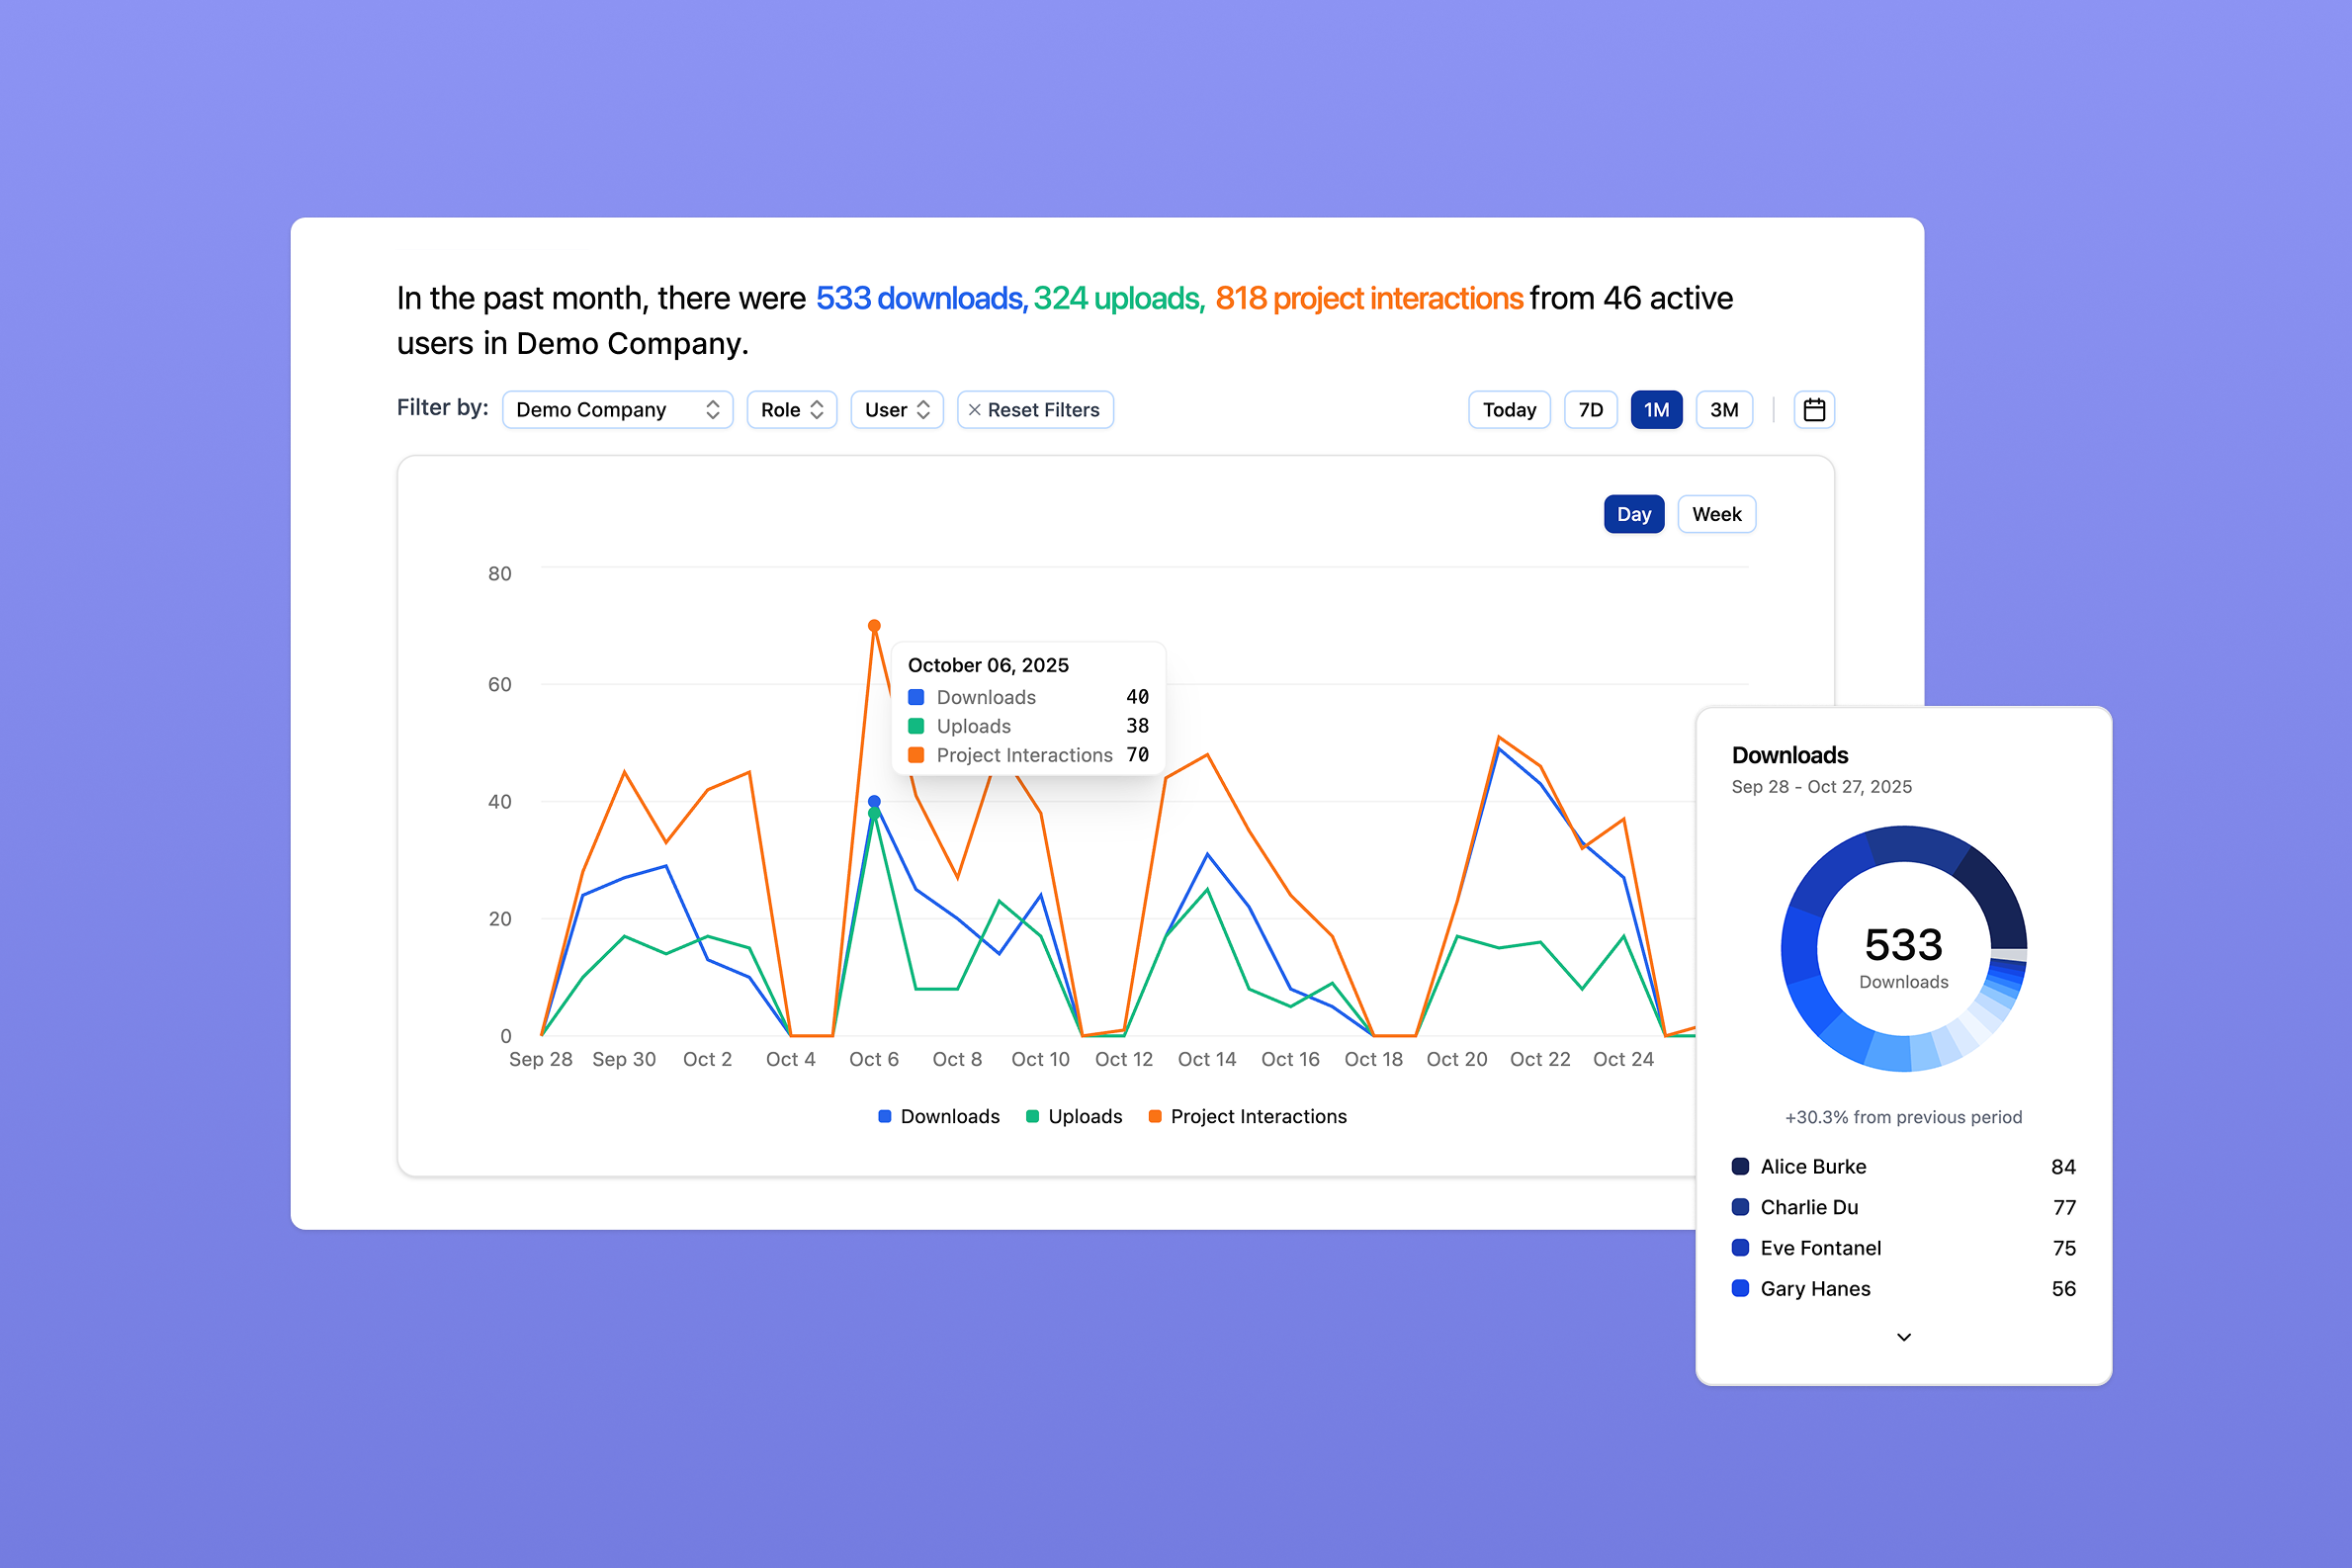
When I joined Rebar, an early-stage construction technology startup, our only analytics tool was a Slack bot that fetched the past 24 hours of usage data. There was no trend analysis, no historical comparisons, no actionable insights. I led the end-to-end design and development of an analytics platform that enables realtime usage monitoring and transforms construction project data into market intelligence for both internal teams and enterprise customers.
impact
Duration
June 2025 - Present
My Role
- Product Designer (1st Design Hire)
- Fullstack Developer (Next.js/TypeScript)
team
- Ryuma Nakahata (Tech Lead)
- Evan Brown (CEO)
- Andrew Schwartz (CPO)
Understanding User and Business Needs
Working with our Tech Lead, CEO, and CPO, I identified three user groups with different needs:
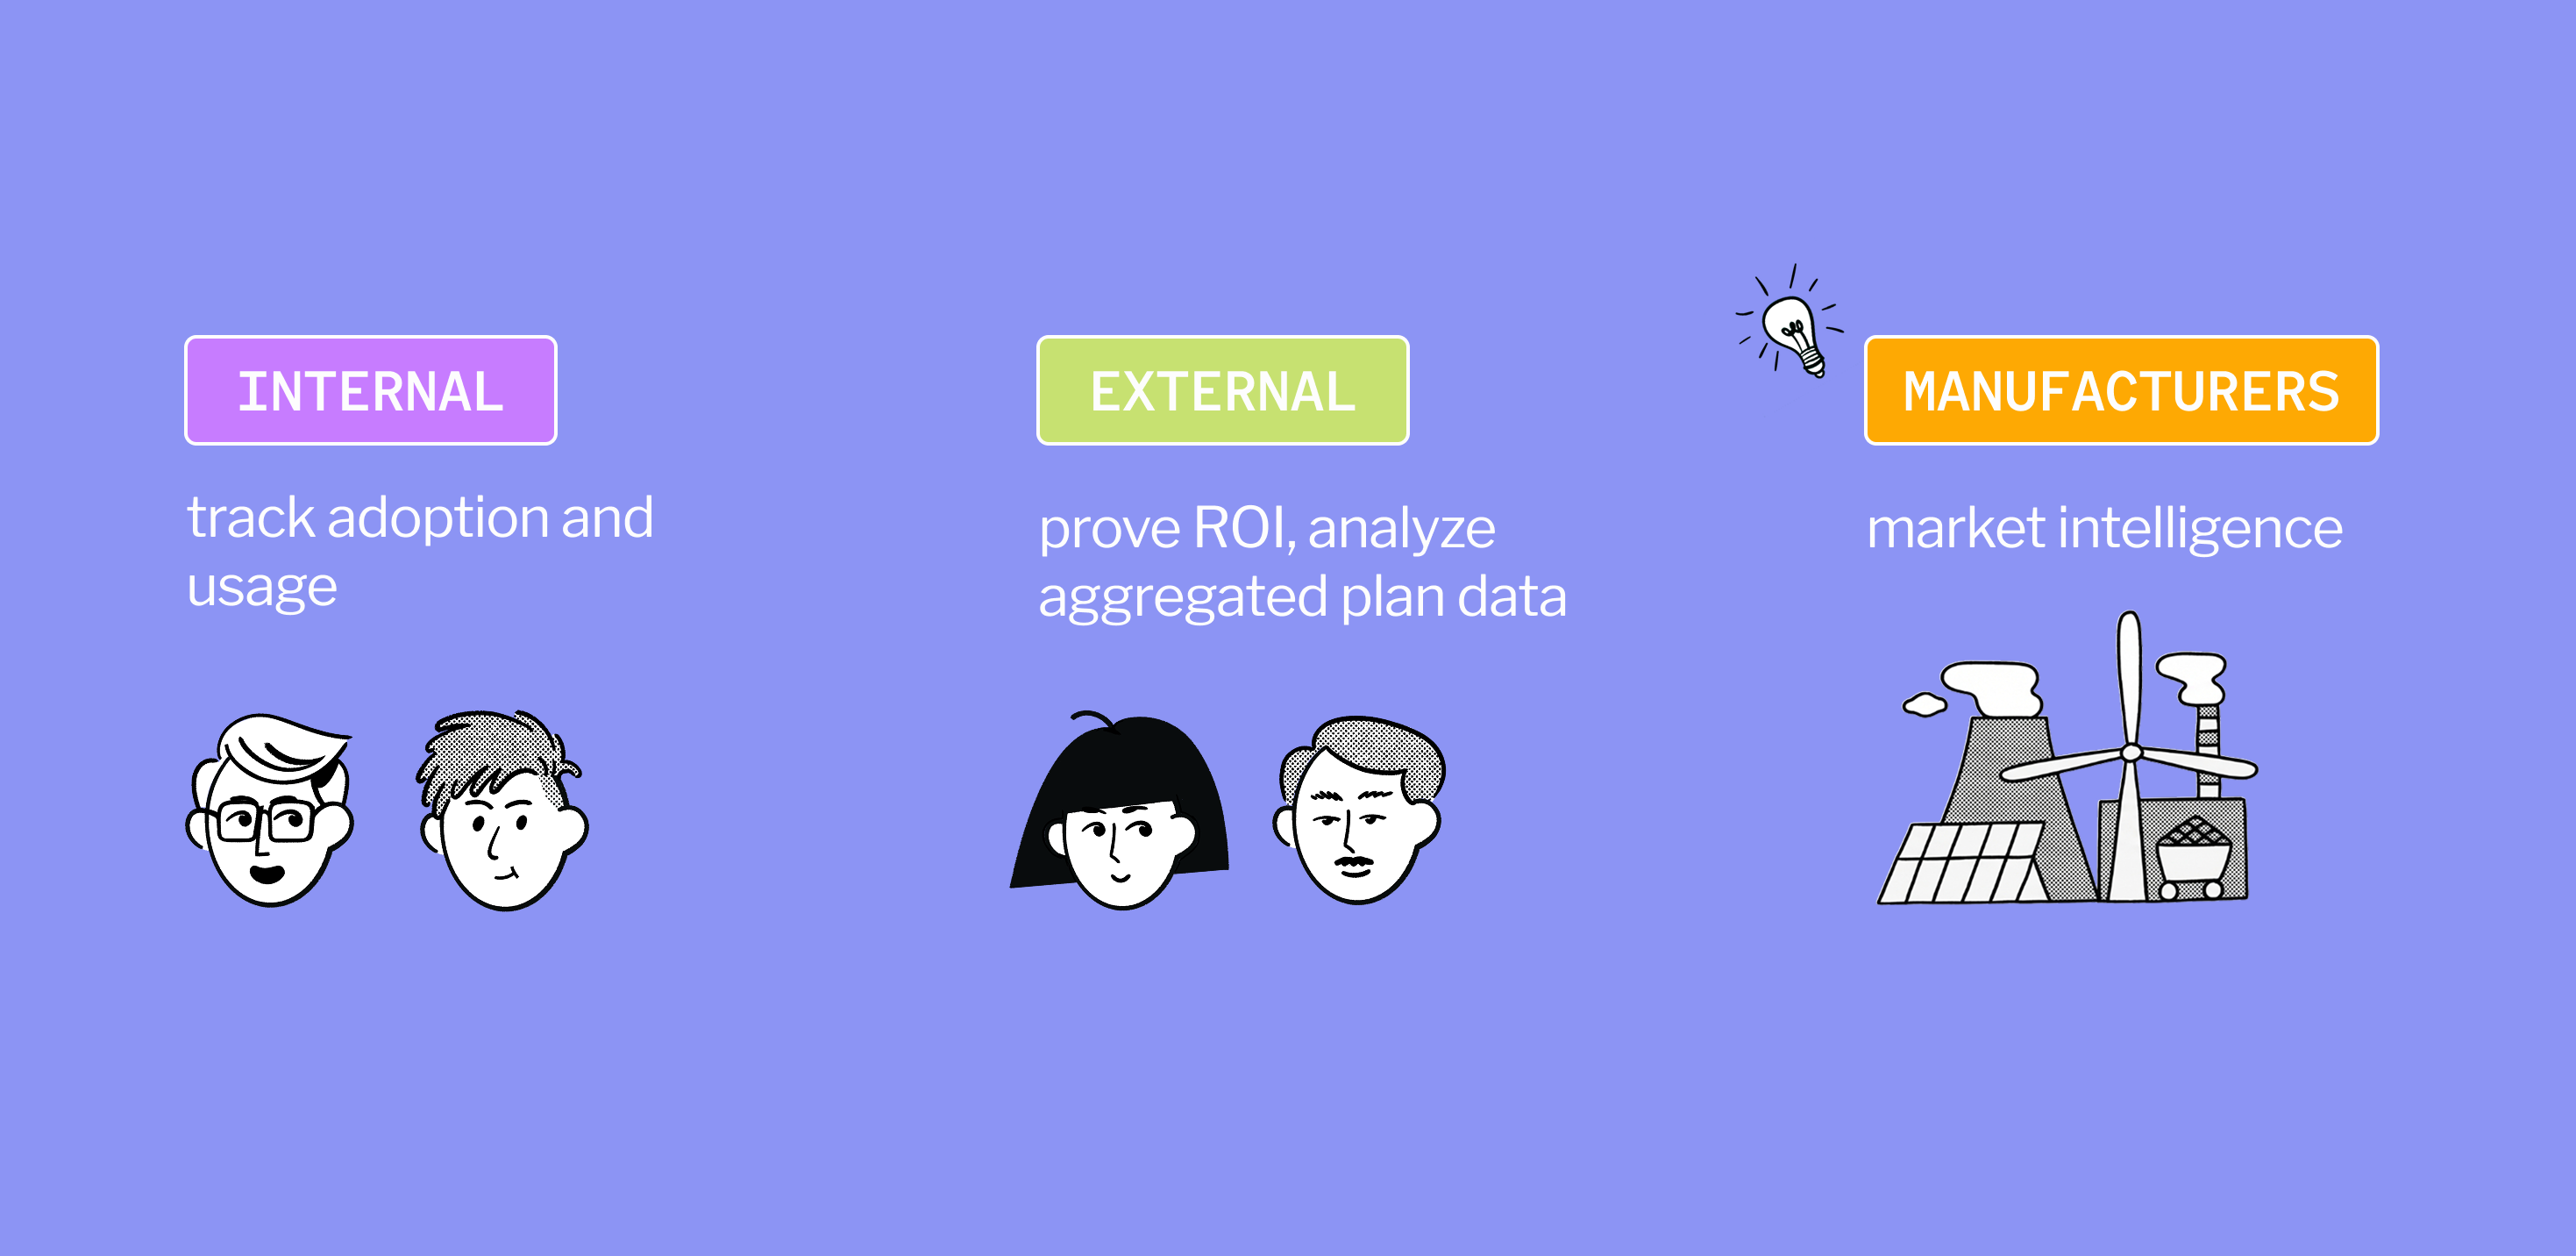
Internal Users (Rebar team)
Track company-level adoption and growth, identify power users and underutilized accounts. Need flexible breakdowns and filters to analyze data.
External Users (Enterprise customers)
Engagement metrics for ROI proof and analyzing data parsed from construction documents.
Manufacturers
Manufacturers are very interested in how their products are being used and how this usage compares to other companies. Previously there wasn't any centralized equipment usage data at scale, but the project information we parse from construction documents is uniquely positioned to provide market intelligence.
Information Hierarchy & Progressive Disclosure
I structured the platform around two analytics categories to meet the needs of the different user groups:
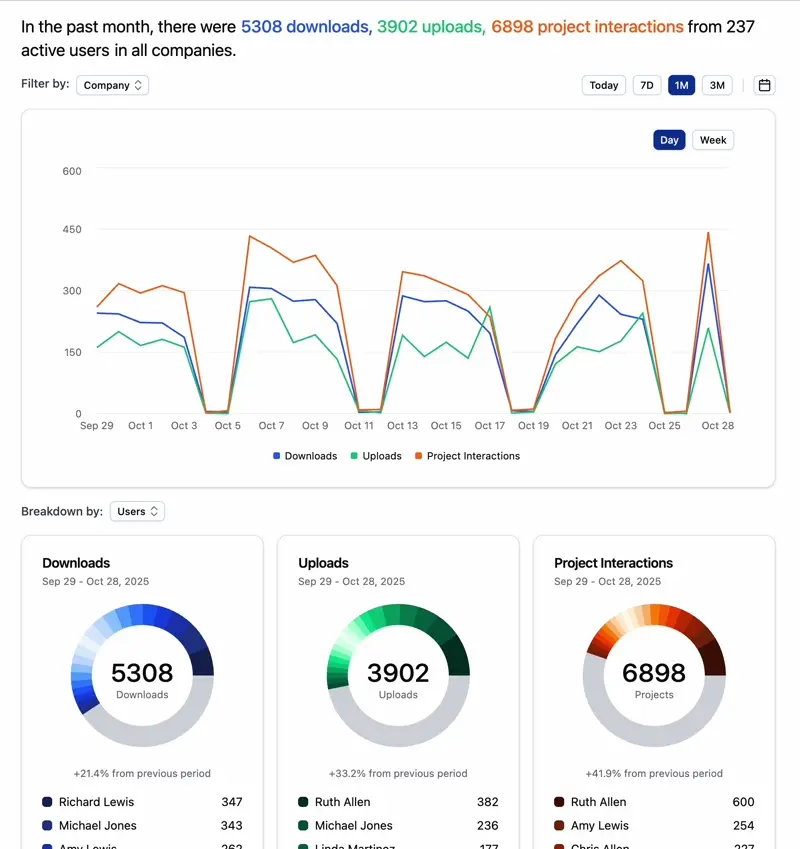
Usage Analytics
User behavior, engagement patterns, adoption metrics (uploads, downloads, project interactions, session duration)
Project Analytics
Market intelligence extracted from construction documents (project locations, engineers of record, architects, equipment manufacturers, market categories)
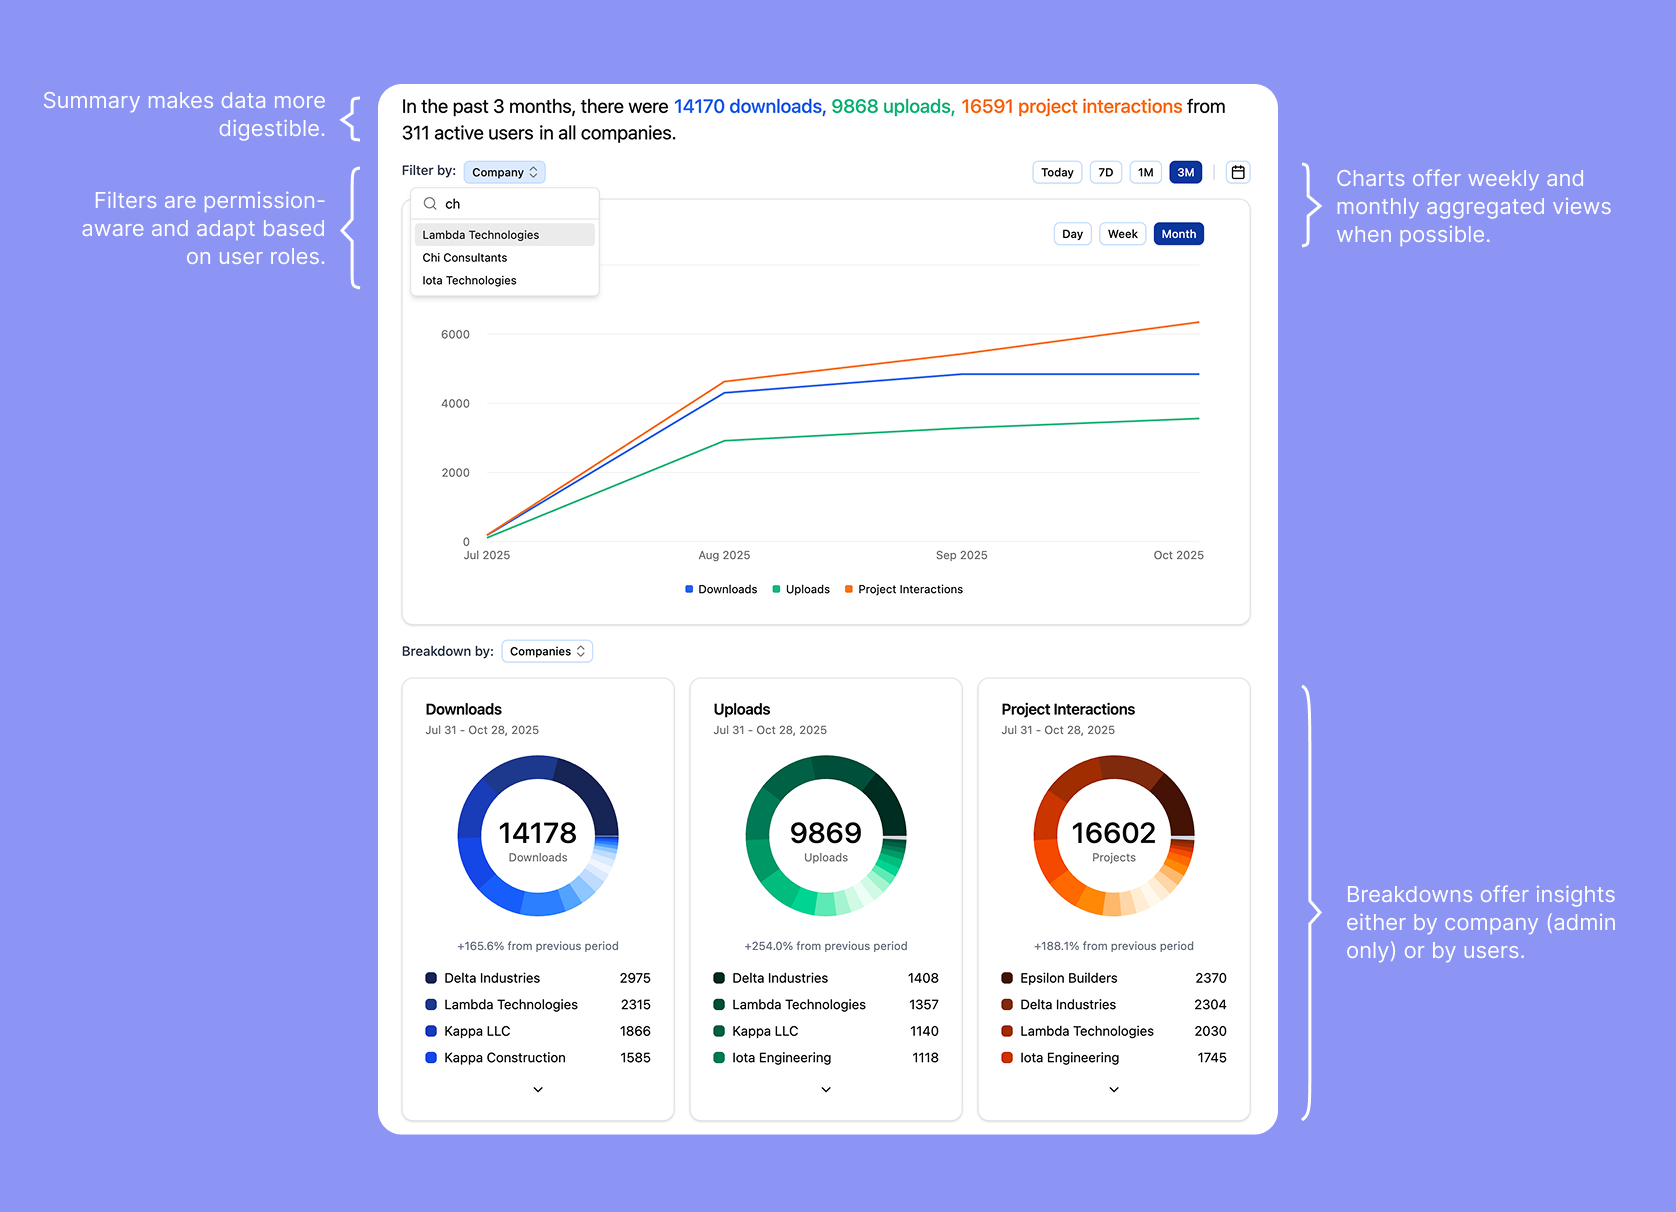
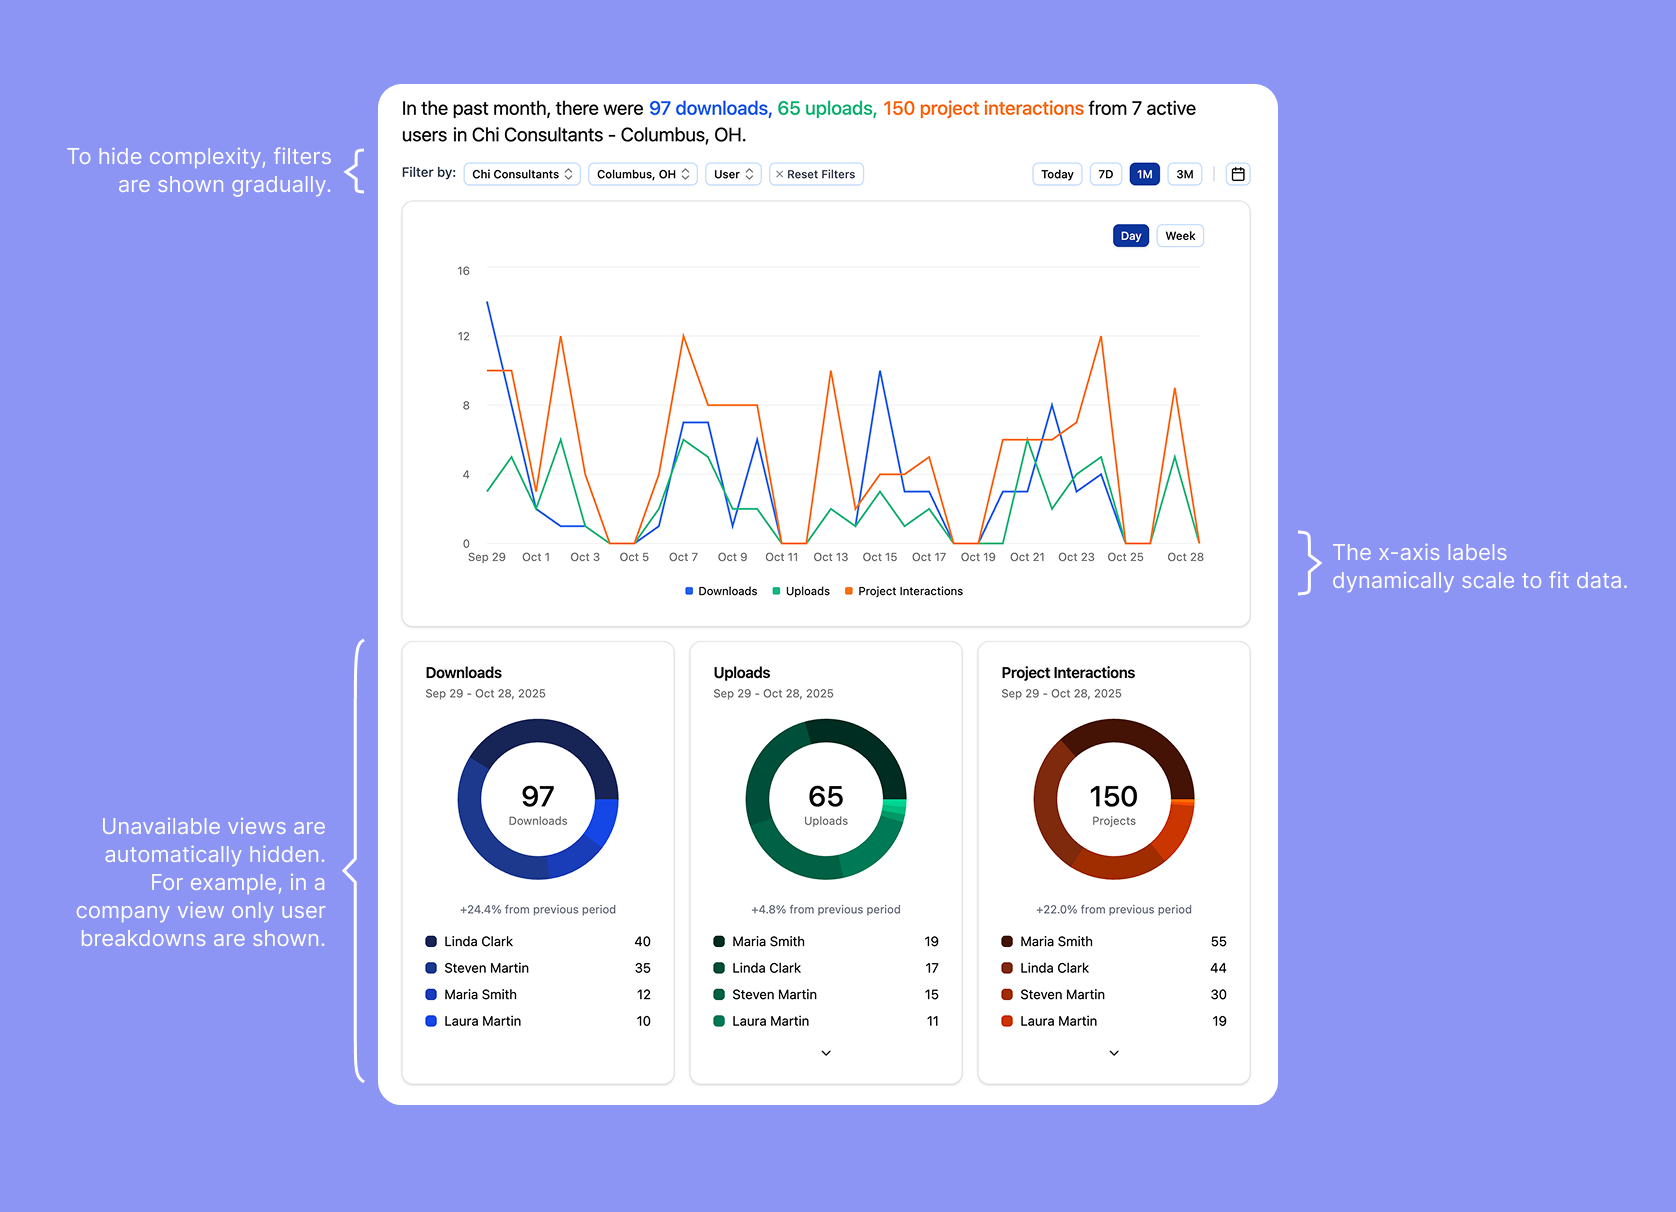
I also designed permission-aware components that adapt to different user roles: Rebar admins are able to information across all companies, enterprise customers see company-specific insights with guided exploration, and manufacturers see project data across companies.
Progressive disclosure patterns prevent users from feeling overwhelmed. Primary insights are always visible, but detailed breakdowns appear on-demand through filters, expandable sections, and hover interactions. For example, donut charts show the top 20 categories and group the long tail into an "Other" segment that expands into a detailed list when clicked. This architecture maintains component reusability (one chart component, multiple permission contexts) while creating distinct experiences optimized for each user's workflow.

V2 Improvements
After the platform's initial launch, I closely monitored user feedback and made three key improvements.
Comparison and Detail Views
In order to allow users to compare data across time periods, I updated each chart component to support two streams of data. I also added a detail view for each chart as a right side panel to show the raw data and the breakdown of the data.
Previously, filters and views were at the top of the page and would often get hidden when scrolling. I moved them to a persistent sidebar to the left of the page for easy access.
Customization
As users wanted to be able to change the size, position, and visibility of charts, I designed and implemented a resizable grid layout. This allows users to customize the appearance and position of the charts to their needs.
Data Cleaning
While Rebar cleans parsed information from construction documents, there can still be errors and inconsistencies. We allow users to rename, delete, and group data points to make charts more accurate and meaningful.
Results & Learnings
What I learned:
- Designing for scale and flexibility: Balancing the needs of different user groups required careful thinking about the information hierarchy and component flexibility.
- Collaboration = speed: Collaborating with our users and constantly asking for feedback allowed us to iterate quickly and improve the platform based on user needs.
- Clarity over complexity: Default to core features, and use progressive disclosure for advanced functionalities.
What I'd do differently:
- Earlier user validation: This is tied to learning #2. Instead of assuming user preferences, ask them. When there's a prototype, invite users to try it out and give feedback.
- More process documentation: In the rush to ship, I didn't document design patterns as I built them. I learned this lesson mid-project and created a component library guide, but starting with that structure would have been more efficient.
The platform enabled enterprise partnerships by surfacing data insights that were previously difficult to collect and aggregate in the construction industry. It has also been adopted internally by the Rebar leadership, engineering, and go-to-market teams for monitoring and improving the product.
This project reinforced my passion for bridging design & engineering to make complex datasets intuitive and actionable. Seeing the tool adopted for real-world business decisions has been incredibly rewarding, and I look forward to applying these learnings to future data-driven projects.